|
|
|
|
|
|
|
|
|
|
|
Statistical Highlights | |
|
|
|
|
|
|
 |
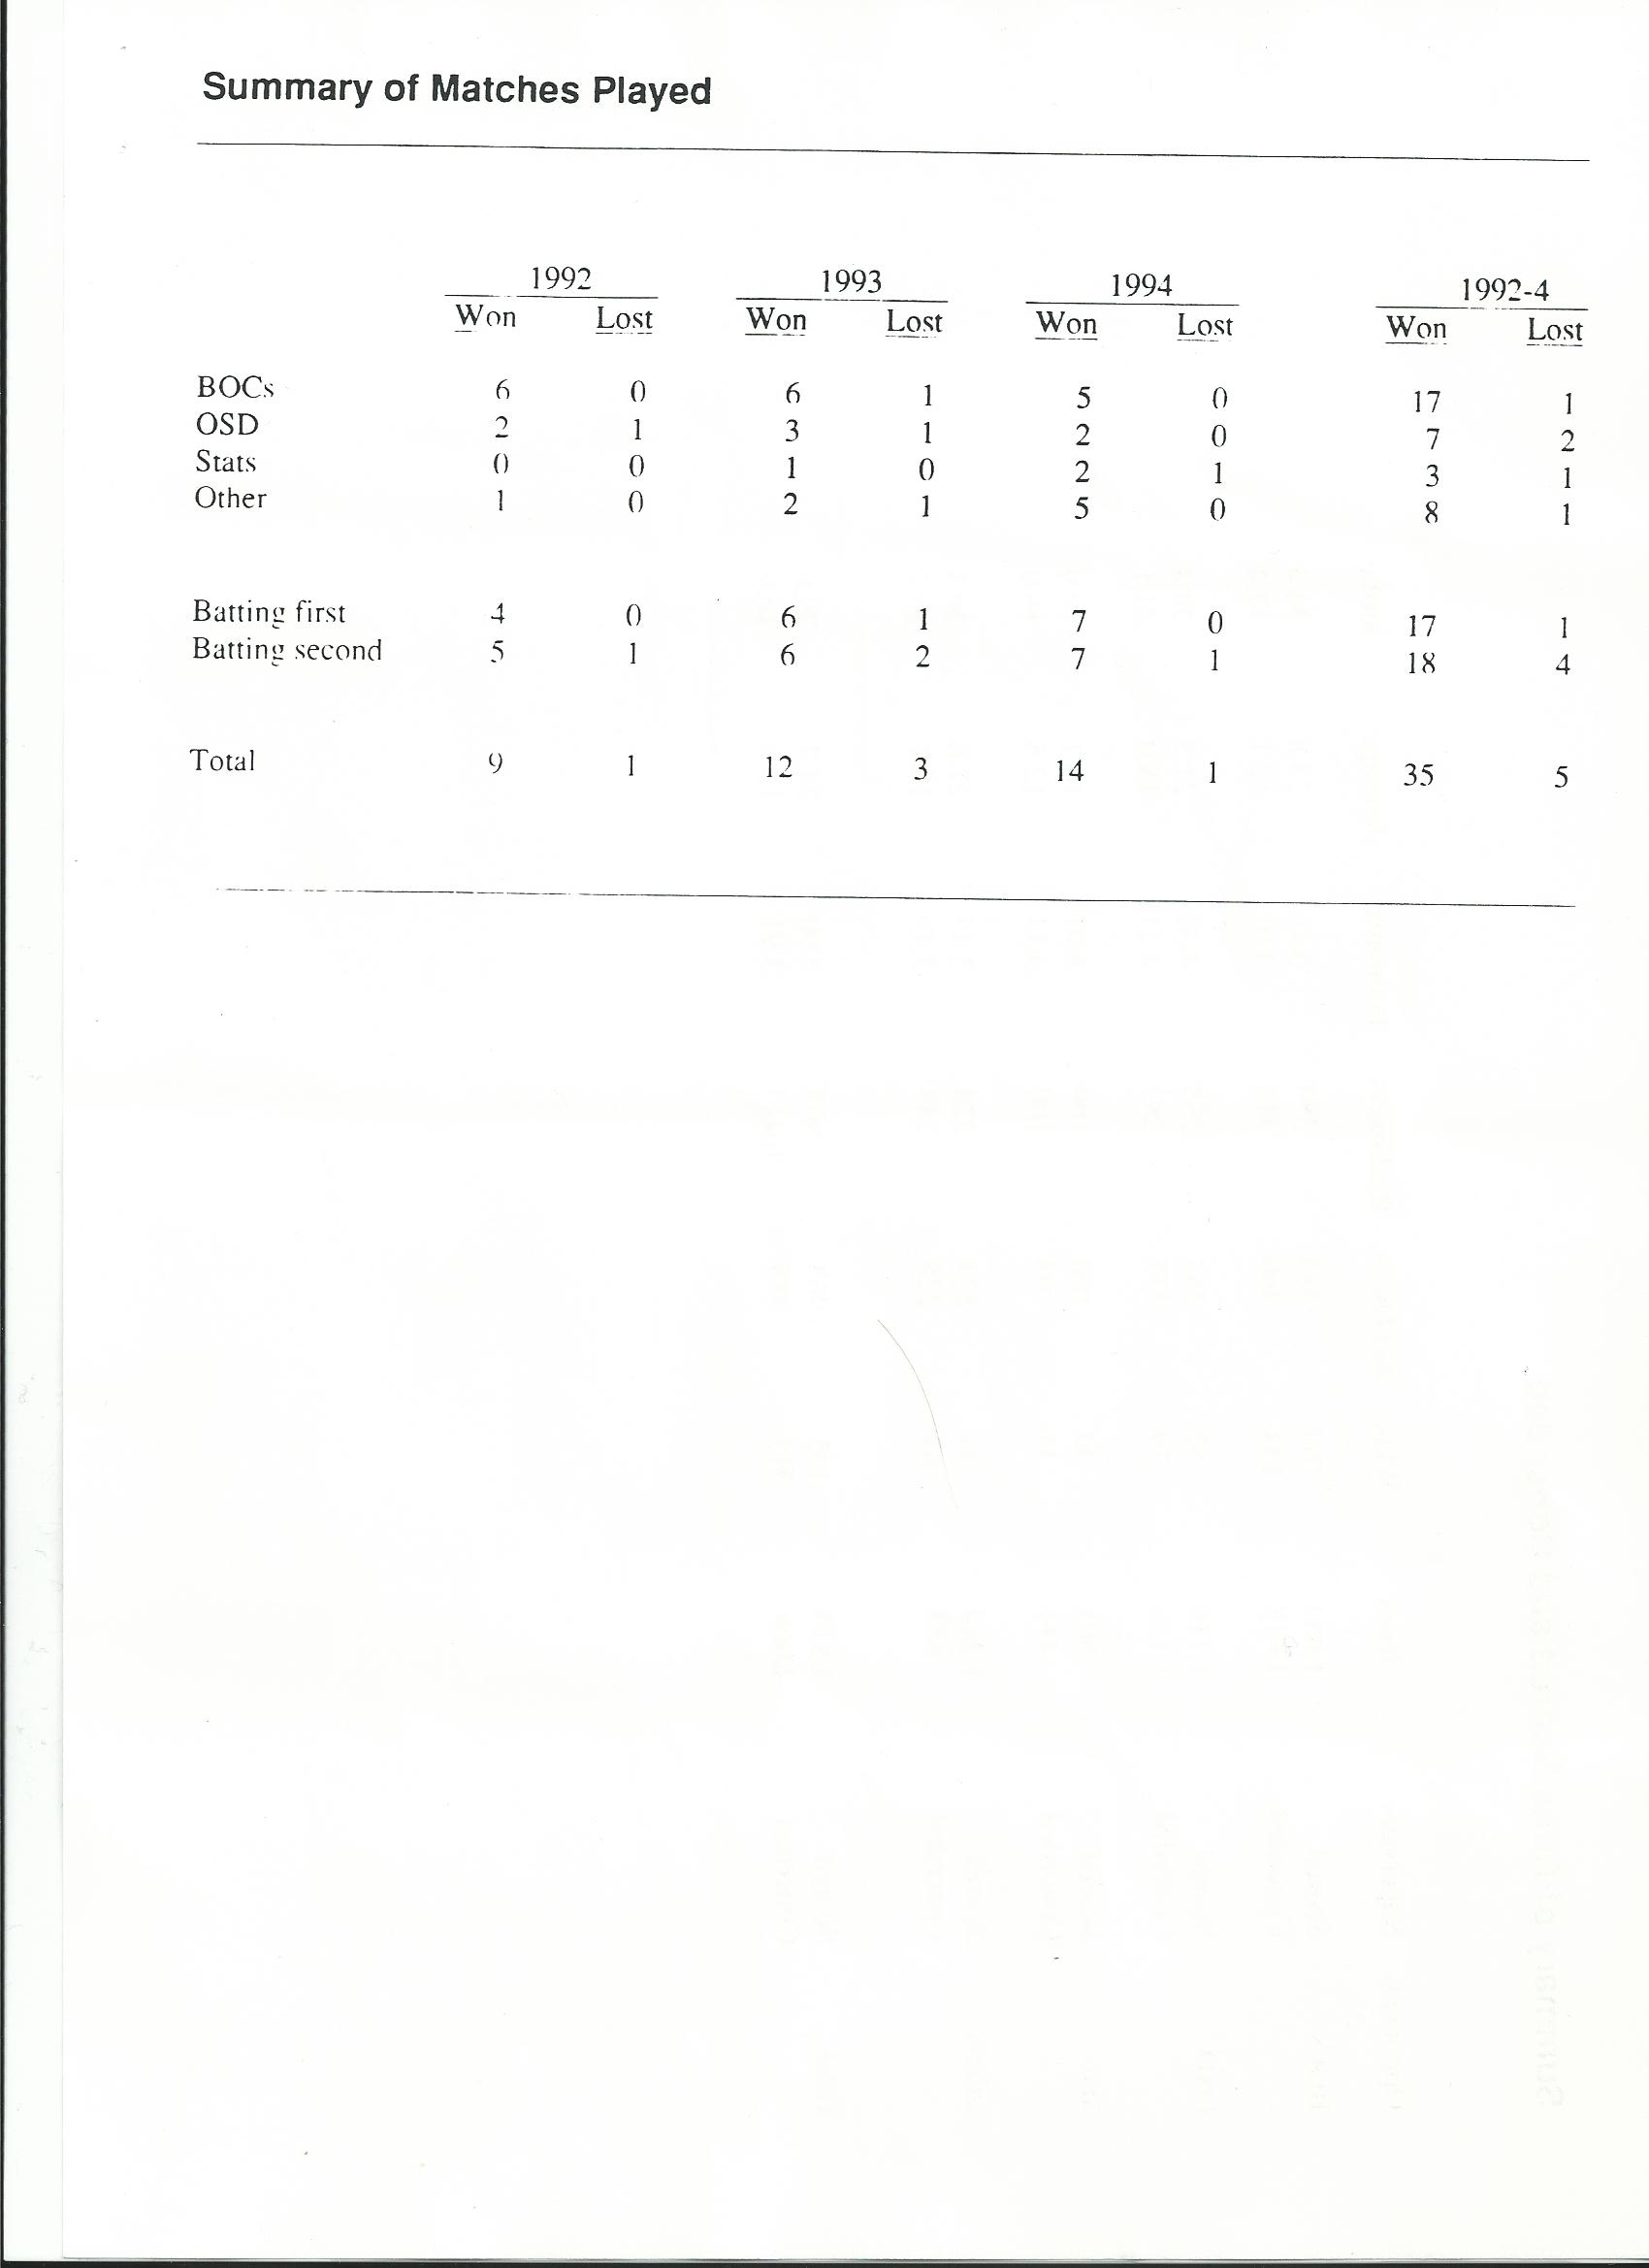
The win percentage of 93.3 was the highest at the time and has never been beaten. |
|
|
|
|
|
The 14 matches won played in 1994 was the most ever in a season at that point. |
|
|
|
|
|
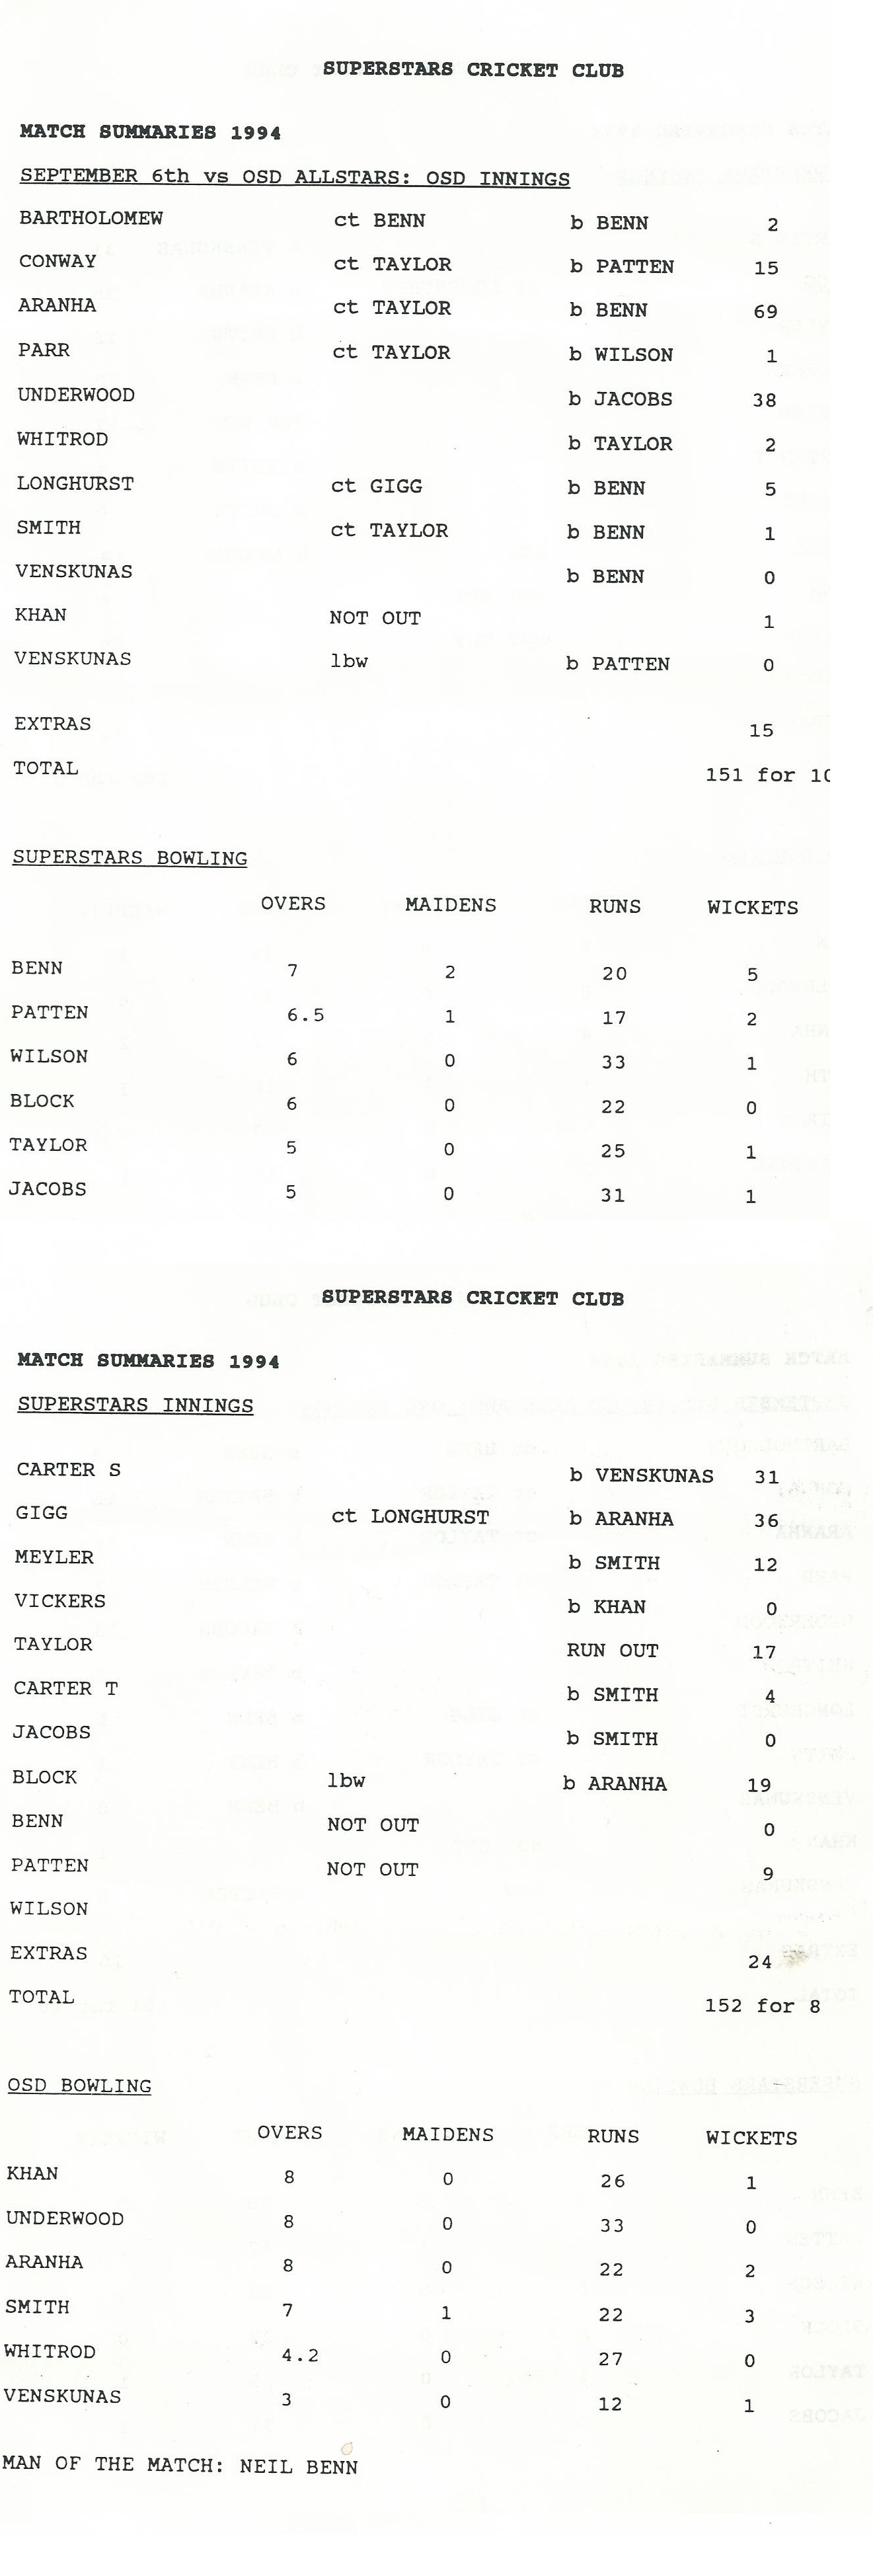
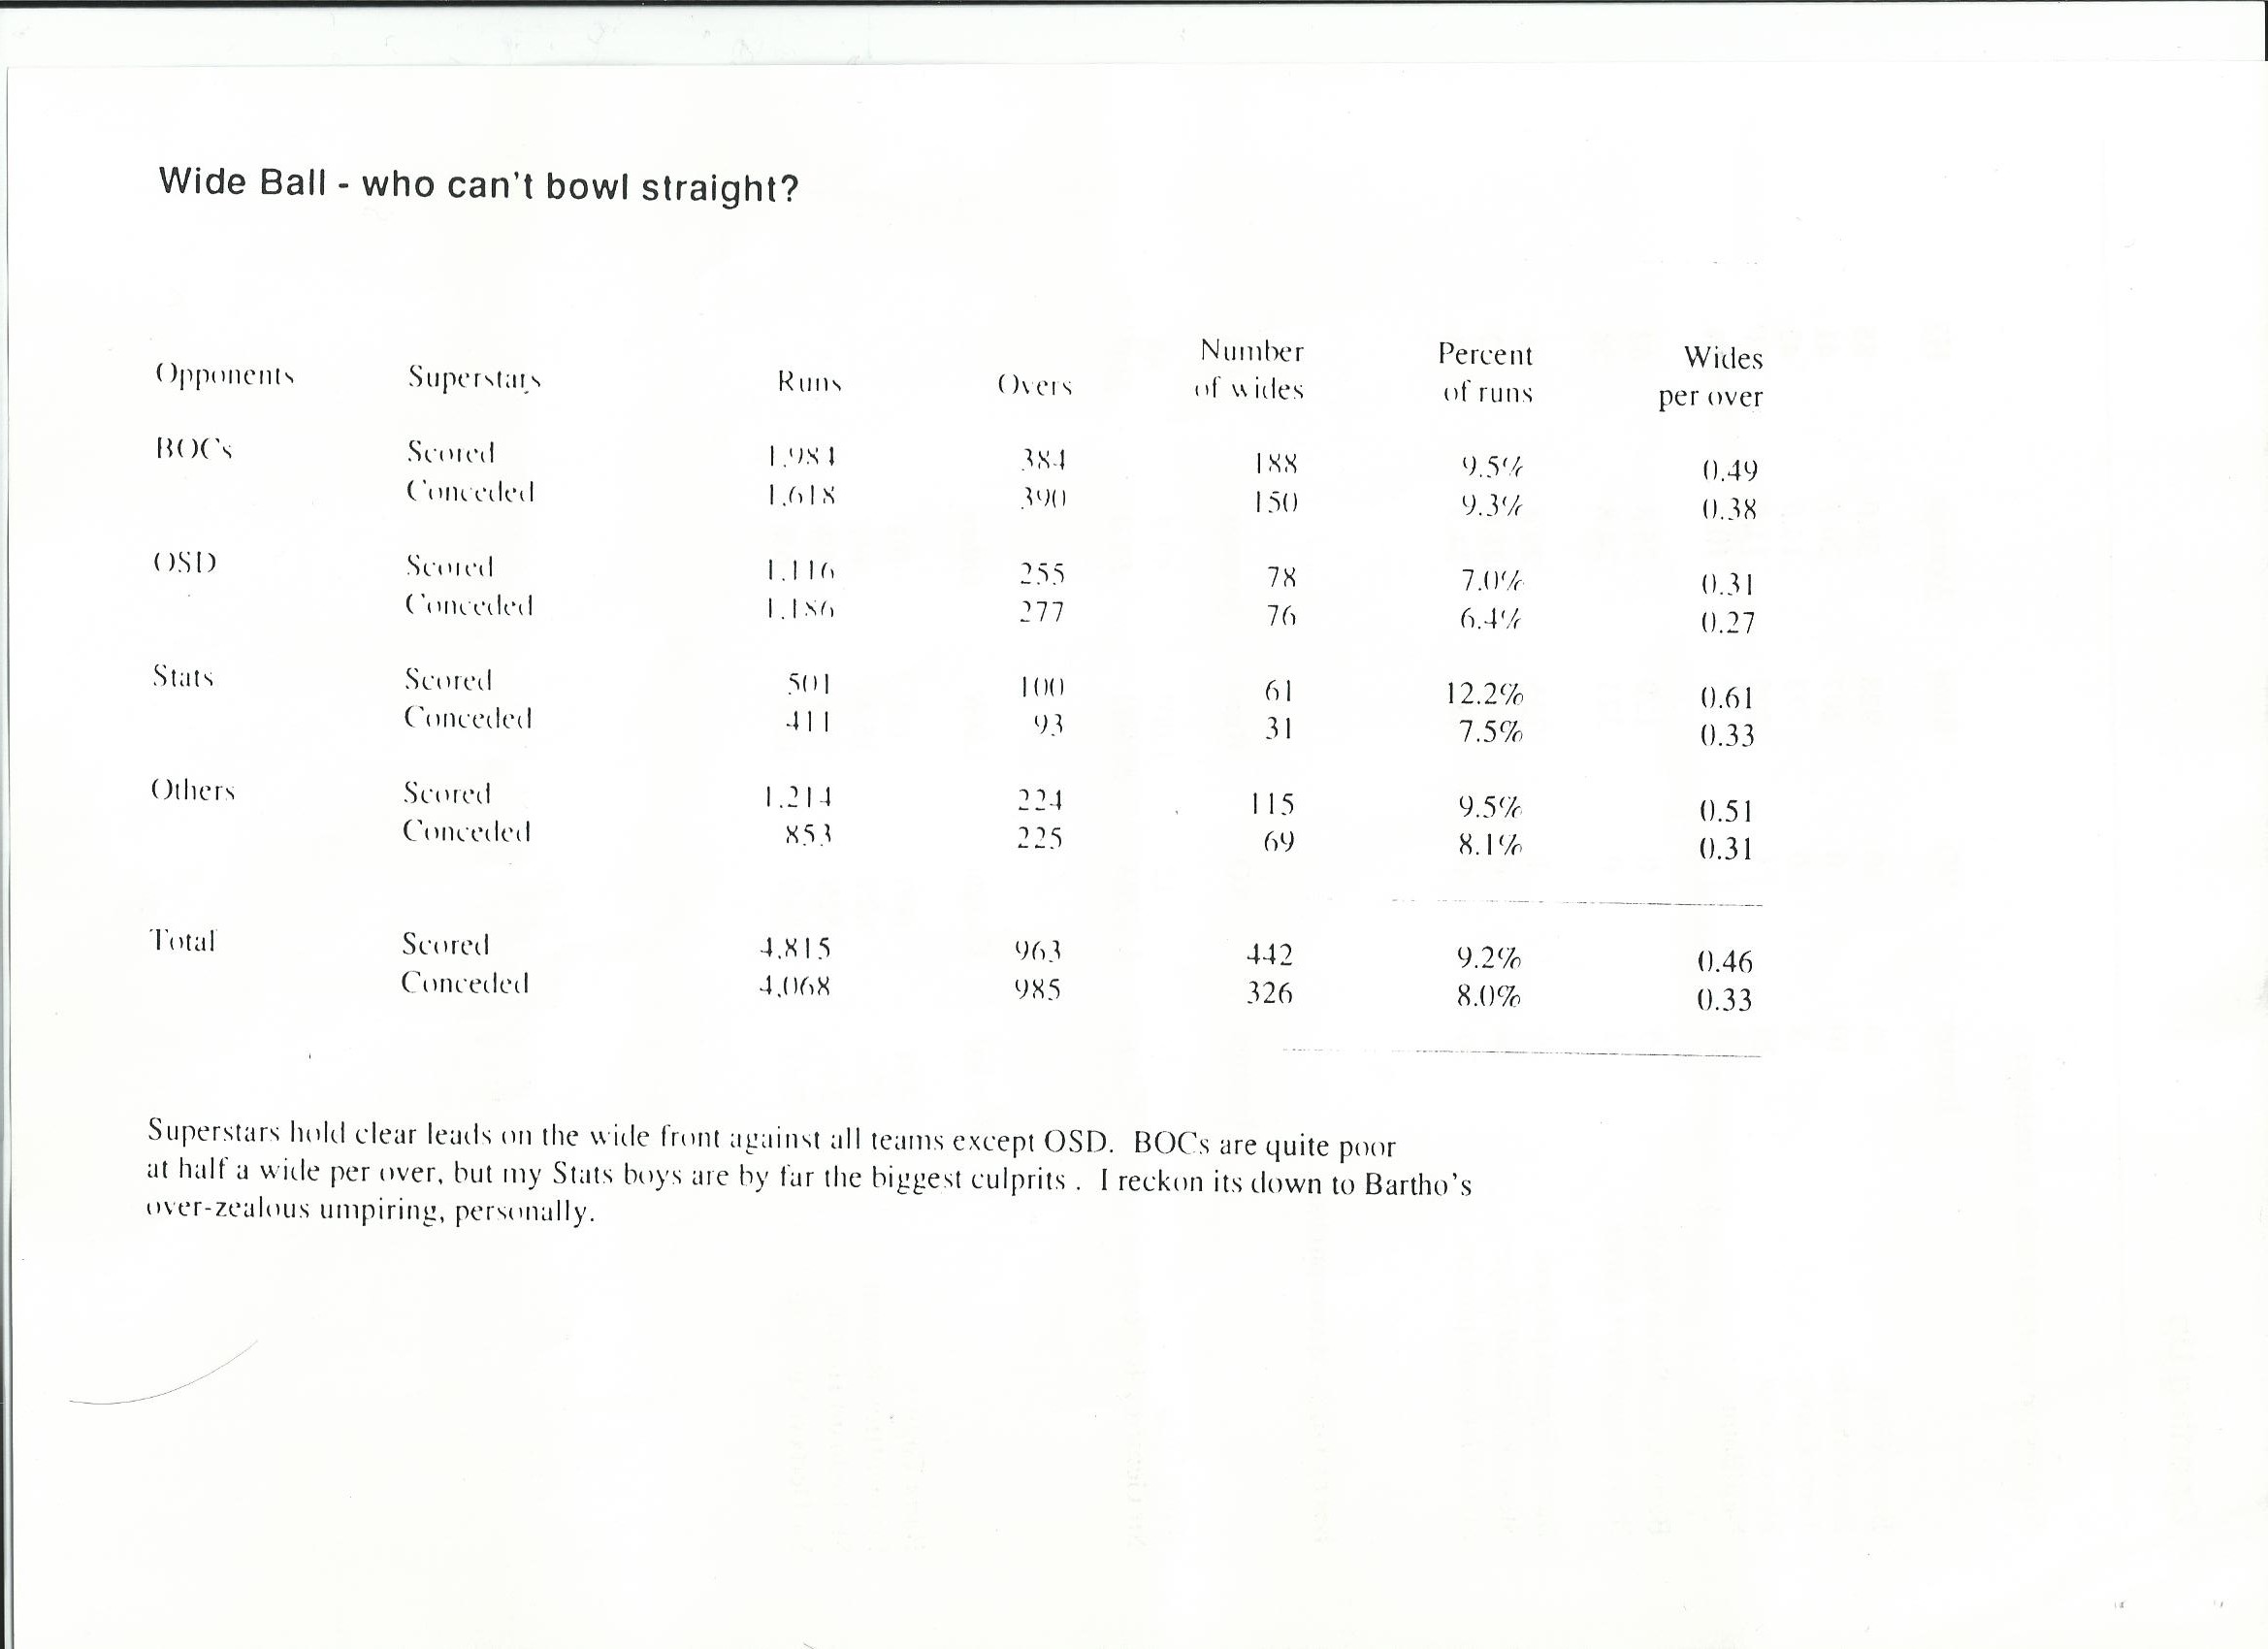
Neil Benn took a hat-trick on 6 September v OSD. |
|
|
|
|
|
|
|
|
|
|
|
|
|
|
|
21 players represented Superstars in 1994, of which 1 (Mike Taylor) had the proud moment of making his debut for the club. |
|
|
|
|
|
|
|
|
|
|
Career Milestones |
|
|
|
|
|
|
|
Barry Gigg |
1000 runs (1st ever Superstar to reach this) |
|
|
|
|
Phil Patten |
50 wickets (3rd ever Superstar to reach this) |
|
|
|
|
Tom Wilson |
50 wickets (4th ever Superstar to reach this) |
|
|
|
|
|
|
|
Barry Gigg |
Superstars record (at the time) 400 runs in the season |
|
|
|
|
Phil Patten |
Superstars record (at the time) 23 wickets in the season |
|
|
|
|
Mike Taylor |
Superstars record (at the time) 11 catches in the season |
|
|
|
|
|
|
|
|
|
|
|
|
|
|
|
|
|
|
|
|
|
|
|
|
|
|
|
|
|
Batting Averages |
|
|
|
|
|
|
|
Qualification: 3 Innings 1 Out |
|
|
|
|
|
|
|
|
|
|
|
|
|
Pos |
|
Player |
|
M |
|
I |
|
NO |
|
Runs |
|
Avge |
|
50s |
|
100s |
|
HS |
|
|
|
|
|
|
|
|
|
|
|
|
|
|
|
|
|
|
|
1 |
|
Barry Gigg |
|
10 |
|
10 |
|
6 |
|
400 |
|
100.0 |
|
2 |
|
- |
|
80 |
|
|
|
|
|
|
|
|
|
|
|
2 |
|
Andy Jacobs |
|
11 |
|
7 |
|
3 |
|
144 |
|
36.0 |
|
1 |
|
- |
|
71no |
|
|
|
|
|
|
|
|
|
|
|
3 |
|
Mike Taylor |
|
12 |
|
9 |
|
2 |
|
211 |
|
30.1 |
|
1 |
|
- |
|
57 |
|
|
|
|
|
|
|
|
|
|
|
4 |
|
Terry Carter |
|
9 |
|
8 |
|
2 |
|
146 |
|
24.3 |
|
1 |
|
- |
|
50no |
|
|
|
|
|
|
|
|
|
|
|
5 |
|
James Vickers |
|
10 |
|
8 |
|
1 |
|
144 |
|
20.6 |
|
- |
|
- |
|
40no |
|
|
|
|
|
|
|
|
|
|
|
6 |
|
Ken Block |
|
15 |
|
6 |
|
2 |
|
82 |
|
20.5 |
|
- |
|
- |
|
31 |
|
|
|
|
|
|
|
|
|
|
|
7 |
|
Steve Meyler |
|
7 |
|
7 |
|
- |
|
139 |
|
19.8 |
|
- |
|
- |
|
41 |
|
|
|
|
|
|
|
|
|
|
|
8 |
|
Gary Bartholemew |
|
9 |
|
9 |
|
3 |
|
111 |
|
18.5 |
|
- |
|
- |
|
43 |
|
|
|
|
|
|
|
|
|
|
|
9 |
|
Tony Whitrod |
|
8 |
|
7 |
|
1 |
|
111 |
|
18.5 |
|
- |
|
- |
|
41 |
|
|
|
|
|
|
|
|
|
|
|
10 |
|
Phil Patten |
|
15 |
|
3 |
|
2 |
|
17 |
|
17.0 |
|
- |
|
- |
|
9no |
|
|
|
|
|
|
|
|
|
|
|
11 |
|
Neil Benn |
|
10 |
|
5 |
|
3 |
|
26 |
|
13.0 |
|
- |
|
- |
|
10 |
|
|
|
|
|
|
|
|
|
|
|
12 |
|
Steve Carter |
|
10 |
|
8 |
|
- |
|
88 |
|
11.0 |
|
- |
|
- |
|
31 |
|
|
|
|
|
|
|
|
|
|
|
|
|
|
|
|
|
|
|
|
|
|
|
|
|
Highest Scores |
|
|
|
|
|
|
|
|
|
|
|
|
|
Pos |
|
Player |
|
Score |
|
Opponents |
|
Date |
|
|
|
|
|
|
|
|
|
|
|
|
|
|
|
|
|
|
|
1 |
|
Barry Gigg |
|
80 |
|
BOCs |
|
2 Aug |
|
|
|
|
|
|
|
|
|
|
|
2 |
|
Andy Jacobs |
|
71no |
|
Lewisham Police |
|
16 Jun |
|
|
|
|
|
|
|
|
|
|
|
3 |
|
Barry Gigg |
|
71no |
|
Dodgers |
|
23 Jun |
|
|
|
|
|
|
|
|
|
|
|
4 |
|
Mike Taylor |
|
57 |
|
DST |
|
12 Jul |
|
|
|
|
|
|
|
|
|
|
|
5 |
|
Terry Carter |
|
50no |
|
Darren Cooper XI |
|
19 Jul |
|
|
|
|
|
|
|
|
|
|
|
|
|
|
|
|
|
|
|
|
|
|
|
|
|
|
|
|
|
|
|
|
|
|
|
|
|
Bowling Averages |
|
|
|
|
|
|
|
Qualification: 10 overs |
|
|
|
|
|
|
|
|
|
|
|
|
|
Pos |
|
Player |
|
O |
|
M |
|
R |
|
W |
|
Avge |
|
Econ |
|
Strike |
|
5wI |
|
BB |
|
|
|
|
|
|
|
|
|
|
|
|
|
|
|
|
|
|
|
1 |
|
Neil Benn |
|
42 |
|
4 |
|
155 |
|
20 |
|
7.8 |
|
3.7 |
|
12.6 |
|
1 |
|
5-20 |
|
|
|
|
|
|
|
|
|
|
|
2 |
|
Phil Patten |
|
69.3 |
|
10 |
|
209 |
|
24 |
|
8.7 |
|
3.0 |
|
17.4 |
|
1 |
|
5-6 |
|
|
|
|
|
|
|
|
|
|
|
3 |
|
Paul Hogg |
|
27 |
|
3 |
|
89 |
|
9 |
|
9.9 |
|
3.3 |
|
18.0 |
|
- |
|
3-25 |
|
|
|
|
|
|
|
|
|
|
|
4 |
|
Mike Taylor |
|
28.1 |
|
2 |
|
103 |
|
10 |
|
10.3 |
|
3.7 |
|
16.9 |
|
- |
|
4-16 |
|
|
|
|
|
|
|
|
|
|
|
5 |
|
Ken Block |
|
70 |
|
14 |
|
207 |
|
18 |
|
11.5 |
|
3.7 |
|
23.3 |
|
- |
|
4-7 |
|
|
|
|
|
|
|
|
|
|
|
6 |
|
Tom Wilson |
|
56 |
|
7 |
|
250 |
|
15 |
|
16.7 |
|
4.5 |
|
22.4 |
|
- |
|
3-15 |
|
|
|
|
|
|
|
|
|
|
|
7 |
|
Andy Jacobs |
|
55 |
|
4 |
|
207 |
|
12 |
|
17.3 |
|
3.8 |
|
27.5 |
|
- |
|
3-11 |
|
|
|
|
|
|
|
|
|
|
|
|
|
|
|
|
|
|
|
|
|
|
|
|
|
|
|
|
|
|
|
Best Individual Bowling |
|
|
|
|
|
|
|
|
|
|
|
|
|
Pos |
|
Name |
|
O |
|
M |
|
R |
|
W |
|
Opponents |
|
Date |
|
|
|
|
|
|
|
|
|
|
|
|
|
|
|
|
|
|
|
1 |
|
Phil Patten |
|
5 |
|
1 |
|
6 |
|
5 |
|
Darren Cooper XI |
|
19 Jul |
|
|
|
|
|
|
|
|
|
|
|
2 |
|
Neil Benn |
|
7 |
|
2 |
|
20 |
|
5 |
|
OSD |
|
6 Sep |
|
|
|
|
|
|
|
|
|
|
|
3 |
|
Ken Block |
|
4 |
|
1 |
|
7 |
|
4 |
|
BOCs |
|
23 Aug |
|
|
|
|
|
|
|
|
|
|
|
4 |
|
Ken Block |
|
8 |
|
3 |
|
15 |
|
4 |
|
Lewisham Police |
|
16 Jun |
|
|
|
|
|
|
|
|
|
|
|
5 |
|
Mike Taylor |
|
5 |
|
0 |
|
16 |
|
4 |
|
OSD |
|
9 Aug |
|
|
|
|
|
|
|
|
|
|
|
|
|
|
|
|
|
|
|
|
|
|
|
|
|
Fielding Stats |
|
|
|
|
|
|
Qualification: 5 dismissals
|
|
|
|
|
|
|
|
|
|
|
|
|
Pos |
|
Name |
|
Ct |
|
St |
|
Total |
|
|
|
|
|
|
|
|
|
|
|
|
|
|
|
|
|
|
|
1 |
|
Mike Taylor |
|
11 |
|
- |
|
11 |
|
|
|
|
|
|
|
|
|
|
|
2 |
|
Ken Block |
|
9 |
|
- |
|
9 |
|
|
|
|
|
|
|
|
|
|
|
3 |
|
Barry Gigg |
|
6 |
|
1 |
|
7 |
|
|
|
|
|
|
|
|
|
|
|
4 |
|
Tony Whitrod |
|
4 |
|
2 |
|
6 |
|
|
|
|
|
|
|
|
|
|
|
5= |
|
James Vickers |
|
5 |
|
- |
|
5 |
|
|
|
|
|
|
|
|
|
|
|
5= |
|
Terry Carter |
|
4 |
|
1 |
|
5 |
|
|
|
|
|
|
|
|
|
|
|
|
|
|
|
Superstars CC- the real story |
|
|
|
|
|
|
|
|
|
I am proud to attach the results of a small arithmetic analysis of the Superstars' matches over the last three years. The data relate to part of 1992, 1993 and 1994. Altogether there are 40 matches, in which our record is 35 wins
and just five defeats.
|
|
|
|
|
|
|
|
|
|
Together they tell the real story of Superstars cricket in recent years - the story that the averages hide. Does Steve Carter take the shine off the ball? Does he urinate in wardrobes? It's all here and more!
|
|
|
|
|
|
|
|
|
|
Neil Benn, October 1994 |
|
|
|
|
|
|
|
|
|
|
|
|
|
|
|
|
|
|
|
|
|
|
|
|
|
|
Barry Gigg - comparison |
|
|
|
|
|
|
|
|
|
|
|
|
|
Name |
|
Inns |
|
NO |
|
Runs |
|
Avge |
|
HS |
|
|
|
|
|
|
|
|
|
|
|
|
|
|
|
|
|
|
|
Barry Gigg |
|
31 |
|
12 |
|
1,001 |
|
52.7 |
|
85 |
|
|
|
|
|
|
|
|
|
|
|
Sir Geoffrey Boycott |
|
1,298 |
|
203 |
|
57,981 |
|
53.0 |
|
261no |
|
|
|
|
|
|
|
|
|
|
|
|
|
|
|
|
|
|
|
|
|
|
|
|
|
|
|
|
|
|
Player Power - the Carter Factor |
|
|
|
|
|
|
|
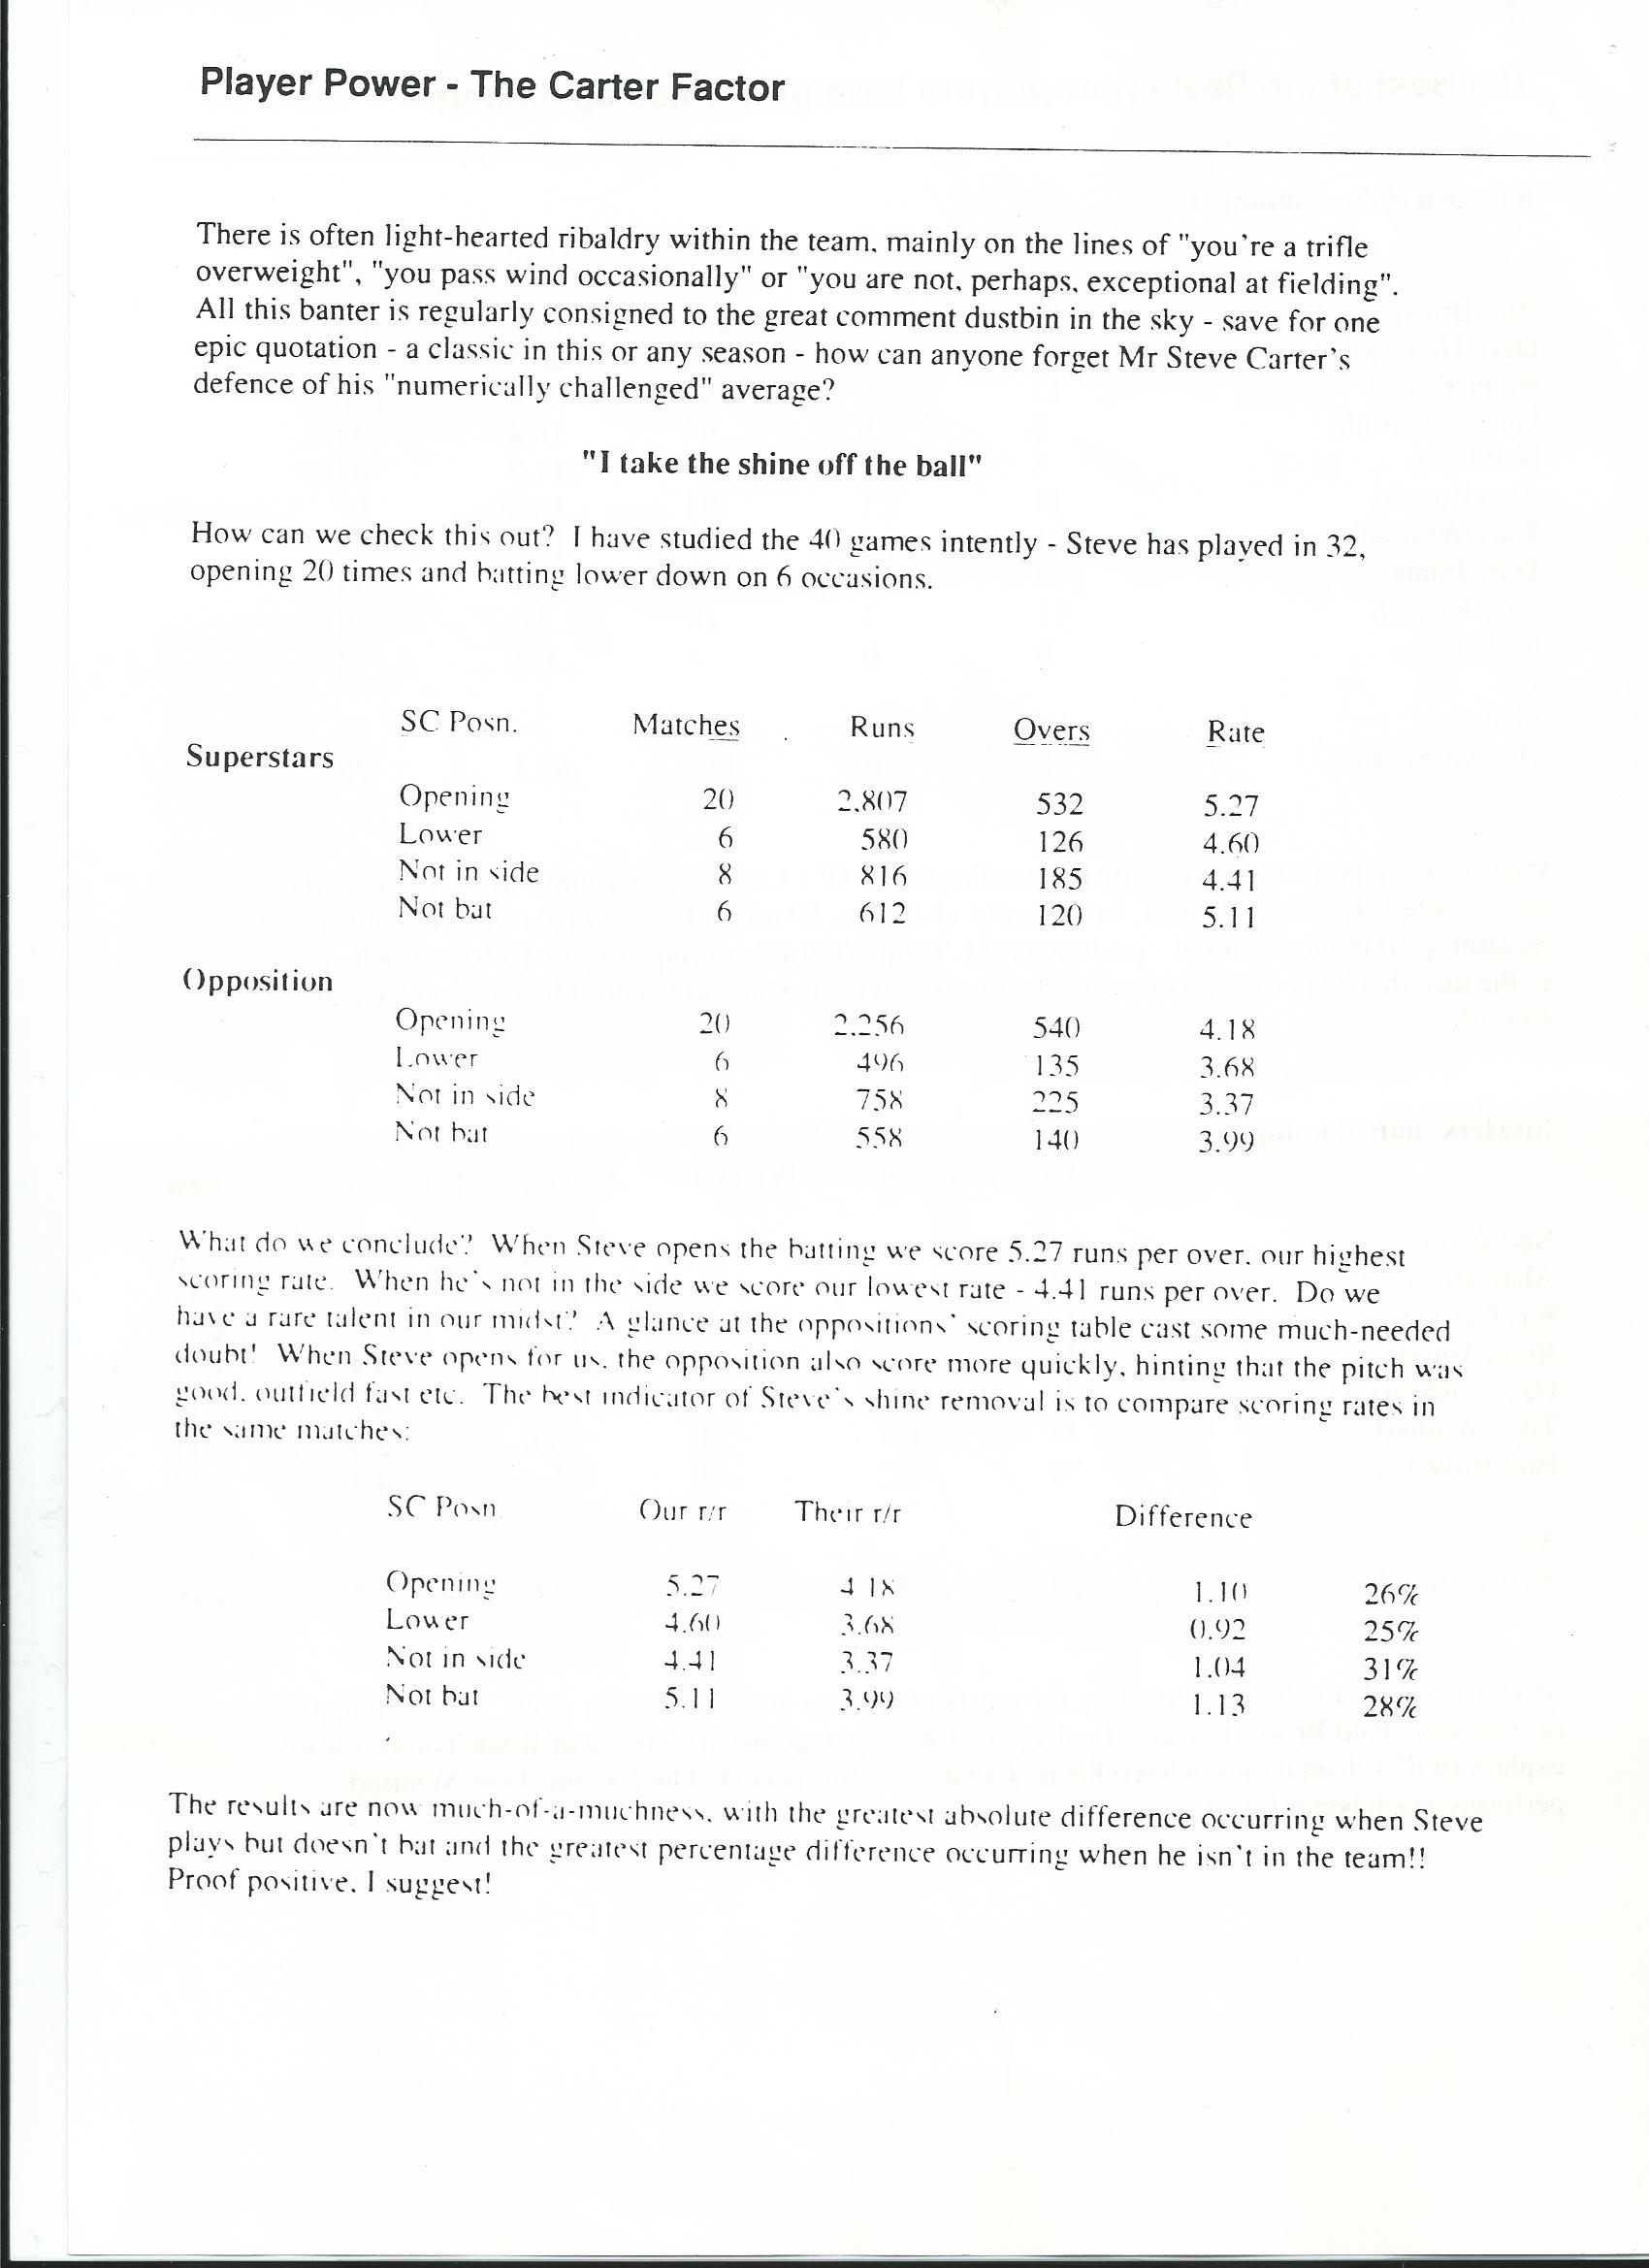
There is often light-hearted ribaldry within the team, mainly on the lines of "you're a trifle overweight", "you pass wind occasionally" and "you are not, perhaps, exceptional
at fielding". All this banter is regularly consigned to the great comment dustbin in the sky - save for one epic quotation - a classic in this or any any season - how can anyone forget Mr Steve Carter's defence of his
"numerically challenged" average? |
|
|
|
|
|
|
|
"I take the shine off the ball" |
|
|
|
|
|
|
|
How can we check this out? I have studied the 40 games intently - Steve has played in 32 opening 20 times and batting lower down on 6 occasions. |
|
|
|
|
|
|
|
|
|
|
|
|
|
Batting Side |
|
SC Position |
|
Matches |
|
Runs |
|
Overs |
|
Rate |
|
|
|
|
|
|
|
|
|
|
|
|
|
|
|
|
|
|
|
Superstars |
|
|
|
|
|
|
|
|
|
|
|
|
|
|
Opening |
|
20 |
|
2,807 |
|
532 |
|
5.27 |
|
|
|
|
|
|
|
|
|
|
|
|
|
Lower |
|
6 |
|
580 |
|
126 |
|
4.60 |
|
|
|
|
|
|
|
|
|
|
|
|
|
Not in side |
|
8 |
|
816 |
|
185 |
|
4.41 |
|
|
|
|
|
|
|
|
|
|
|
|
|
Not bat |
|
6 |
|
612 |
|
120 |
|
5.11 |
|
|
|
|
|
|
|
|
|
|
|
|
|
|
|
|
|
|
|
Opposition |
|
|
|
|
|
|
|
|
|
|
|
|
|
|
Opening |
|
20 |
|
2,256 |
|
540 |
|
4.18 |
|
|
|
|
|
|
|
|
|
|
|
|
|
Lower |
|
6 |
|
496 |
|
135 |
|
3.68 |
|
|
|
|
|
|
|
|
|
|
|
|
|
Not in side |
|
8 |
|
758 |
|
225 |
|
3.37 |
|
|
|
|
|
|
|
|
|
|
|
|
|
Not bat |
|
6 |
|
558 |
|
140 |
|
3.99 |
|
|
|
|
|
|
|
|
|
|
|
|
|
What do we conclude? When Steve opens the batting we score at 5.27 runs per over, our highest scoring rate. When he's not in the side we score our lowest rate 4.41
runs per over. Do we have a rare talent in our midst? A glance at our opposition' scoring table cast some much needed doubt! When Steve opens for us the opposition score more quickly, hinting that the pitch was good, outfield fast etc.
The best indicator of Steve's shine removal is to compare scoring rates in the same matches. |
|
|
|
|
|
|
|
The results are now much of a muchness, with the greatest absolute difference occuring when Steve plays but doesn't bat (5.11-3.99=1.13) and the greatest
percentage difference occuring when he isn't in the team (4.41-3.37=1.04 =31%)!! Proof positive I suggest. |
|
|
|
|
|
|
|
If you would like to look at further info the whole of Neil's Statistical analysis is available below. (Take a bow Mike Taylor on Page 8!) |
|
|
|
|
|
|
|
Page 1 Page 2
Page 3 Page 4
Page 5 Page 6
Page 7 Page 8 |
|
|
|
|
|